October 6, 2018

Data Management and Analysis

After data collection, the data should be managed and processed in a systematic order to obtain valid results through appropriate analysis techniques. There are certain data processing operations before the data go through analysis procedure.


1. Editing: 
Editing of data is a process of examining the collected raw data (especially in surveys) to detect errors and omissions and to correct these when possible. As a matter of fact, editing involves a careful scrutiny of the completed questionnaires and/or schedules. Editing is done to assure that the data are accurate, consistent with other facts gathered, uniformly entered, as completed as possible and have been well arranged to facilitate coding and tabulation.
  • Field Editing: It consists in the review of the reporting forms by the investigator for completing (translating or rewriting) what the participants have written in abbreviated and/or in illegible format at the time of recording the respondents’ responses.
  • Central Editing: It should take place when all forms or schedules have been completed and returned to the office.

2. Coding: 
Coding refers to the process of assigning numerals or other symbols to answers so that responses can be put into a limited number of categories or classes. Such classes should be appropriate to the research problem under consideration. Coding is necessary for efficient analysis and through it the several replies may be reduced to a small number of classes which contain the critical information required for analysis.


3. Classification: 
Most research studies result in a large volume of raw data which must be reduced into homogeneous groups if we are to get meaningful relationships. Data having a common characteristic are placed in one class and in this way the entire data get divided into a number of groups or classes.

  • Classification according to attributes: For e.g. data are classified on the basis of common characteristics such as gender, education status, religion, etc.
  • Classification according to class-intervals: For e.g. age (21-30, 31-40, 41-50)

4. Data Entry: 
Data entry is the act of entering information into electronic formats by using word processing or data processing software hosted on a computer and its data entry operators who perform these tasks. Some of the software for data entry are EpiData, MS EXCEL, etc. While entering data, it is always advisable to enter only numbers as far as possible, which at first, speed up entering the process and secondly reduces the chances of entering wrong, meaningless, erroneous information.


5. Data Cleaning:
Data cleansing or data cleaning is the process of identifying and removing (or correcting) inaccurate records from a dataset, table, or database and refers to recognizing unfinished, unreliable, inaccurate or non-relevant parts of the data and then restoring, remodeling, or removing the dirty or crude data.


6. Tabulation:

The process of placing classified data into tabular form is known as tabulation. Tabulation is the process of summarizing raw data and displaying the same in compact form (i.e., in the form of statistical tables) for further analysis. In a broader sense, the tabulation is an orderly arrangement of data in columns and rows.


7. Data Analysis: 
Data Analysis is the process of systematically applying statistical and/or logical techniques to describe and illustrate, condense and recap, and evaluate data. The popular software for data analysis is SPSS (Statistical Package for the Social Sciences). Other softwares are R software, STATA, etc. Analysis may, therefore, be categorized as descriptive and causal analyses, and inferential analysis (Inferential analysis is often known as statistical analysis)

a. Descriptive and Causal Analyses:
Descriptive analysis is largely the study of distributions of one variable. Causal analysis is concerned with the study of how one or more variables affect changes in another variable. It is thus a study of functional relationships existing between two or more variables.

  • Univariate Analysis (Analysis of one variable): Frequency analysis [Measures of Central Tendency (Mean, median, mode), Measures of dispersion (range, standard deviation, mean deviation), Percentile values], Measures of skewness, One-way ANOVA, etc.
  • Bivariate Analysis (Analysis of two variables): Simple regression (causal analysis and simple correlation, Association of attributes, Two-way ANOVA
  • Multivariate Analysis (Analysis of more than two variables): Multiple Regression, Multiple correlation, Multi-ANOVA, Factor analysis


b. Inferential analysis/Statistical analysis:
Inferential analysis is concerned with the various tests of significance for testing hypotheses in order to determine with what validity data can be said to indicate some conclusion or conclusions. It is also concerned with the estimation of population values. It is mainly on the basis of inferential analysis that the task of interpretation (i.e., the task of drawing inferences and conclusions) is performed. We especially perform estimation of parameter values (Point estimate, Interval estimate) and test hypotheses (Parametric tests, Non-parametric tests) in inferential or statistical analysis.



Variables

A variable is an empirical property that can take on two or more values. If a property can change in value or kind, then it is regarded as a variable. For e.g. weight (value), gender (kind)

Attribute: An attribute is a specific value on a variable.

Importance of variable:
  • Variables help to present and analyze the data in a convenient way
  • Identification of variables helps in the presentation of data
  • Variables help to achieve objectives of the research
  • Variables help to test the hypothesis


Data Collection Techniques and Tools

Ø  What is Data?
Data is the plural of Latin word “Datum” which means any information that is given or provided for the solution of a problem.

Ø  Types of Data
  • Primary Data: those which are collected afresh and for the first time, and thus happen to be original in character. 

  • Secondary Data: those which have already been collected by someone else and which have already been passed through the statistical process.

  • Categorical Data: Those data which are divided into groups or categories.                        
                             -Nominal Data (e.g. male/female)
                             -Ordinal Data: rank based (e.g. low, middle, high)

  • Numerical Data: Those values and observations which are based on numbers and can be measured. 
                              - Discrete Data (e.g. number of patients)
                              - Continuous (e.g. blood pressure, weight)


Ø  Sources of Data
Primary data collection uses surveys, experiments, interviews, questionnaires or direct observations. Primary data has not been published yet and is more reliable, authentic and objective. 

Secondary data collection may be conducted by collecting information from a diverse source of documents or electronically stored information, census and market studies. Sources of secondary data can be listed as follows: 

  • Published Printed Sources 
  • Books 
  • Reports (government, non-government) 
  • Record Database, Record file/Register 
  • Journals/E-journals 
  • Magazines/Newspapers 
  • Published Electronic Sources 
  • General website, blogs 
  • Grey literatures

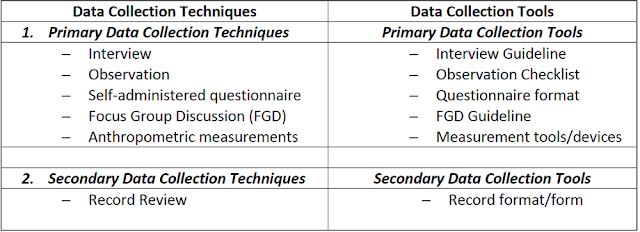
Ø  Data Collection Techniques and Tools
Data collection technique is a process of gathering information on targeted variables in an established systematic fashion, which then enables one to answer relevant questions and evaluate outcomes. 

Data collection instrument/tool refers to the device or guideline used to collect data, such as a paper questionnaire or computer-assisted interviewing system, etc.


There are several data collection techniques and tools which are as follows:


a.      Interview:
Interview is a systematic procedure with scientific purpose where verbal information is produced by posing specific questions to the subject of interest.

                      i. Face to face Interview

                     ii. In-depth interview

                    iii. Key Informant Interview

                    iv. Based on structure: Structured, Semi-Structured, Unstructured


b.     Observation:
Observation relies on the researchers’ ability to gather data through their senses and allows researchers to document actual behavior rather than responses related to behavior.
  1. Descriptive observation: the observer simply write down what he/she observes
  2. Inferential observations: the observer may write down an observation that is inferred by the subject’s body language and behavior.
  3. Evaluative observation: the observer makes an inference and therefore a judgment from the behavior. The findings should be made sure to be replicated.

c.      Self-administered questionnaire
Questionnaire is a group or sequence of questions designed to collect information from an informant or respondent when completed unaided by the respondent. In case of inability to complete the questionnaire by the respondent, he/she can be asked by the interviewer and assisted by the interviewer to complete the questionnaire.


d. Focus Group Discussion (FGD)
A focus group discussion (FGD) is an in-depth field method that brings together a small homogeneous group (usually six to twelve persons) to discuss topics on a study agenda. The purpose of this discussion is to use the social dynamics of the group, with the help of a moderator/facilitator, to stimulate participants to reveal underlying opinions, attitudes, and reasons for their behavior.


e. Anthropometric Measurements
Anthropometric measurements are used to assess the size, shape, and composition of the human body such as BMI, waist-to-hip ratio, skin-fold test, etc. in order to determine status under study consideration like nutritional status, etc. for identifying needs and goals of the study and planning health care or community programs to address the health issues and problems in that community. There are various types of measurements:
                         - Anthropometry
                         - Biomedical Tests
                         - Clinical Observations


f. Record Review
Record review is the technique used for secondary data collection. A record is composed of fields and contains all the data about one particular person, company, or item in a database.

October 1, 2018

Sampling

  • Sample: 
In research terms a sample is a group of people, objects, or items that are taken from a larger population for measurement. The sample should be representative of the population to ensure that we can generalize the findings from the research sample to the population as a whole.

  • Sampling Frame: 
Sampling Frame is a list of elements belonging to the population from which the sample will be drawn.

  • What is Sampling?
Sampling means selecting a given number of subjects from a defined population as representative of that population. The main objective of sampling is to get a representative sample of the population by minimizing time, cost and human resources, and help to estimate and test the validity of the estimated population parameter.

  • Sampling Error:
Sampling error is the difference between the survey result and population value due to the random selection of individuals or households to include in the sample. Sampling error is the error in a statistical analysis arising from the unrepresentativeness of the sample taken. Sampling error can make a sample unrepresentative of its population.

  • Sampling Bias: 
Sampling bias is a bias in which a sample is collected in such a way that some members of the intended population are less likely to be included than others.

  • Types of Sampling Methods
1. Probability Sampling: Probability sampling is also known as ‘random sampling’ or ‘chance sampling’. Under this sampling design, every item/subject of the sample frame has an equal chance of inclusion in the sample.

                Types of Probability Sampling

                a. Simple Random Sampling
                b. Systematic Sampling
                c. Stratified Sampling
                d. Cluster Sampling
                e. Multi-stage Sampling

2. Non-probability Sampling: Non-probability sampling is a sampling technique where the samples are gathered in a process that does not give all the individuals in the population equal chances of being selected.

              Types of Non-probability Sampling

             a. Purposive sampling
             b. Quota sampling
             c. Snowball sampling
             d. Convenience sampling


  • Differences between Probability and Non-probability Sampling


  • Simple Random Sampling (SRS)
In this method, the samples are drawn in such a way that each unit of the population has equal and independent chance of being selected in the sample. The samples can be drawn with or without replacement. In this method, sampling can be done by two ways: Lottery methods and random number table.

Advantage of SRS: It eliminates personal bias, the results are more accurate as sample size increases, and the method is very simple.

Disadvantage of SRS: It requires complete sampling frame, the method is not suitable to isolate members from a group.

  • Systematic Sampling
It is a random sampling and the sampling process is carried out on systematic manner/ rule, i.e. the samples are selected at regular interval (of time, items or observations) from the sampling frame.

Sample Interval (K) = Total Population
                                 Sample Size

Advantages: The sampling method is simple and easy, it gives more precise result than SRS for homogenous population, time cost and labor is relatively small.

Disadvantages: It needs complete sampling frame, the system may interact with same hidden pattern in the population.

  • Stratified Sampling
When the populations are heterogeneously distributed throughout the region, then divide the target population into number of subgroups (called strata). The stratification is done in such a way that population within each strata are homogenous and various strata are non-overlapping i.e. each and every unit of the population belongs to one and only one stratum. The samples are drawn from each stratum using simple random sampling.
The stratification is done in such a way that population within each strata are homogenous and various strata are non-overlapping i.e. each and every unit of the population belongs to one and only one stratum. The samples are drawn from each stratum using simple random sampling.
Advantages: Same sampling fraction can be used for all strata to ensure the proportional representation in the sample characteristic being stratified. Each unit in the strata has equal chance of being selected in the sample.
Disadvantages: The sample frame has to be prepared separately for each stratum. It can be complex and time-consuming.

  • Cluster Sampling
When the population is densely distributed throughout the region, the population is classified into different subgroups known as cluster in such a way that within the cluster the population are heterogeneous and between the clusters are homogenous. The simple random sampling technique is used to select the relevant clusters.
Advantage: Cluster sampling method cut down the cost and time of preparing sampling frame and greater speed. The sampling frame is required only for the selected clusters and individuals in selected clusters.
Disadvantages: It is less accurate and errors of estimates are high.

  • Multi-stage Sampling
It is a complex form of cluster sampling and involves several stages in which the sampling process is carried out. In the first stage, large group or clusters are selected. These clusters are designed to contain more population units than are required for the final sample. In the second stage, population units are chosen from selected clusters to derive a final sample. If more than two stages are used, the process of choosing population units within clusters continues until the final sample is achieved.
Advantage: It is flexible and efficient.
Disadvantages: Sampling error is increased compared with simple random sampling of the same size.

  • Purposive sampling
In this method, the choice of sample units is selected deliberately or purposively depending upon the object of investigation. It entirely depends upon the personal convenience, beliefs and prejudices of the investigator. The advantage of purposive sampling is that it is very cheap and if selection is done carefully, gives relevant results. The major drawback of this sampling method is that it is highly subjective in nature since the selection of the sample entirely depends upon the personal convenience, beliefs and prejudices of the investigator.


  • Convenience sampling
In this method, the sample items from the population are selected which are convenient way to the researcher. It is no randomness sampling and likelihood of bias is high. It is fast, easy and less expensive to collect the information, but the result obtained by this method, hardly be representative of the population. This method is useful for making a pilot study and pretesting of questionnaire. To study the mass behavior this sampling can be used.

  • Quota sampling
Quota sampling resembles like special form of stratified sampling. The specified sub-groups/reserved items called quota from the population are collected according to the desire of enumerator or researcher. In this method, the interviewer is told in advance the number of sampling units he/she is to enumerate from specified sub-groups (quota) of the population assigned. The selection of the sample is non-random and purposive thus induces bias.


  • Snowball sampling
This method can be used to access too hard to reach or hidden populations like drug addicts, homeless people, individuals with HIV/AIDS, prostitutes and so on. Snowball sampling has chain type links to the sampling units. There are two steps to create snowball sampling. First, try and identify one or more units from the population. Secondly, use these units to find further units and so on until the required number of sample size is fulfilled.